
Keywords
Introduction
Y-chromosomal short tandem repeats (Y-STRs) are widely used in forensic genetics, paternity testing, and anthropological studies due to their paternal inheritance pattern and the absence of recombination across most regions of the Y chromosome [1,2]. Approximately 95% of the Y chromosome comprises the non-recombining region (NRY). Mutational changes at Y-STR loci represent an important source of informative haplotypic variation for forensic analysis and the inference of recent paternal relatedness [2,3]. This makes Y-STR profiling useful for assessing paternal relationships, identifying male contributions in mixed DNA samples, and tracing paternal family lineages. The primary mechanism underlying STR mutations is polymerase slippage during DNA replication. This process typically results in the gain or loss of a single repeat unit [4,5]. Although such mutations occur infrequently, their characterization is important for accurate forensic genetic interpretation. Y-STR markers can assist in differentiating paternal lineages; however, failure to account for mutational events may result in false exclusions in father–son Cpaternity testing [1,6]. Accordingly, accurate knowledge of mutation rates across different Y-STR loci is essential for robust forensic interpretation and the development of population-specific reference databases. Recent large-scale pedigree analyses and forensic reviews have emphasized the importance of population-specific mutation rate data for reliable kinship assessment and likelihood ratio estimation [1,7]. The present study investigates Y-STR mutations in 292 paternal lineage cases from the North Indian population. By comparing Y-STR profiles among close and distant paternal relatives, this study provides insights into mutation patterns, locus-specific variation, and their forensic relevance in genetic investigations.
\(\text{Adoption gap (%)} = (\frac{x-y}{x}) \times 100\)
Materials and Methods
Study Population
This study is a retrospective analysis of anonymized data derived from routine casework conducted between August 2016 and December 2024 at an ISO 15189-accredited laboratory in North India. A total of 292 paternal lineage cases from the North Indian population were included. Institutional Ethics Committee approval was obtained before data analysis and manuscript preparation. Written informed consent was obtained from all participants at the time of sample collection as part of routine casework.
Sample Collection and Dna Extraction
Peripheral blood (3 mL) was collected in EDTA vacutainer tubes (BD Vacutainer®, USA) as part of routine casework for Y-STR analysis. No additional sample collection or experimental intervention was performed specifically for this study. DNA extraction was performed using a Macherey-Nagel solid-phase extraction kit (Germany) according to the manufacturer’s instructions, followed by DNA quantification using a Qubit® 2.0 Fluorometer (Invitrogen, USA).
Pcr Amplification and Genotyping
Genotyping was performed using the Yfiler™ PCR Amplification Kit (Thermo Fisher Scientific, USA) with approximately 1 ng of template DNA. PCR cycling was performed on a Veriti Thermal Cycler under standard conditions: initial denaturation at 95 °C for 11 min, followed by 30 cycles at 94 °C for 1 min, 61 °C for 1 min, and 72 °C for 1 min, with a final extension at 60 °C for 80 min. PCR products were analyzed on a SeqStudio Genetic Analyzer after mixing with Hi-Di™ formamide and LIZ® size standard. Allele calling was performed using GeneMapper® v5 software.
Statistical Analyses
Mutation rates were estimated using a direct counting approach, where the number of observed mutational events was divided by the total number of meioses analyzed at each locus. Per-locus and overall mutation rates were reported to three decimal places. Exact 95% confidence intervals were estimated using the Clopper–Pearson method under a binomial distribution framework. Data tabulation and calculations were performed using Microsoft Excel.
Results
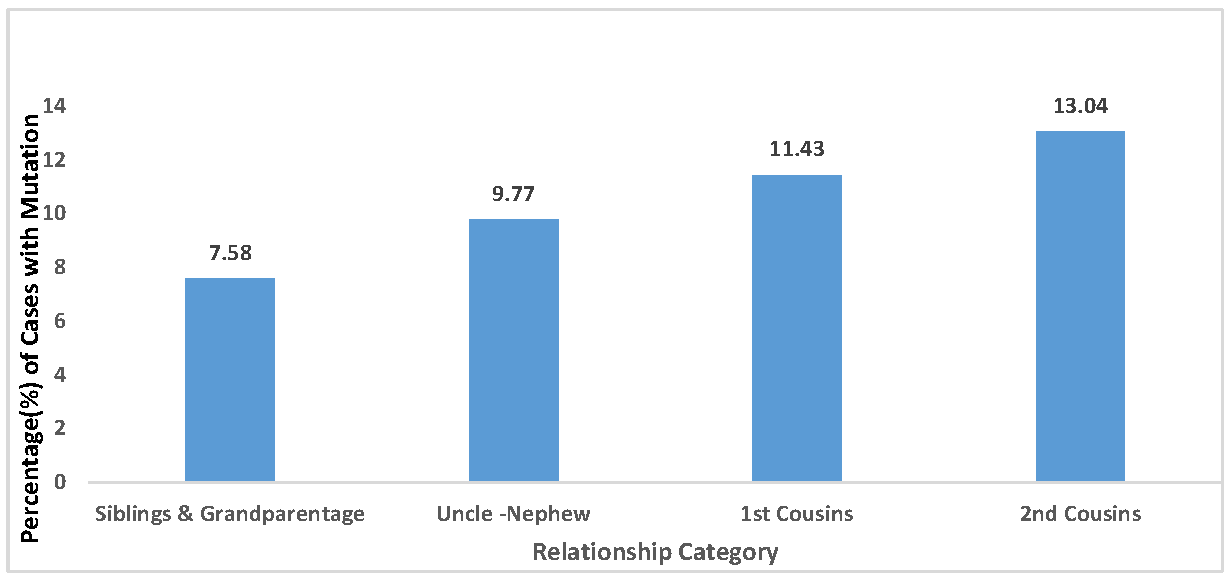
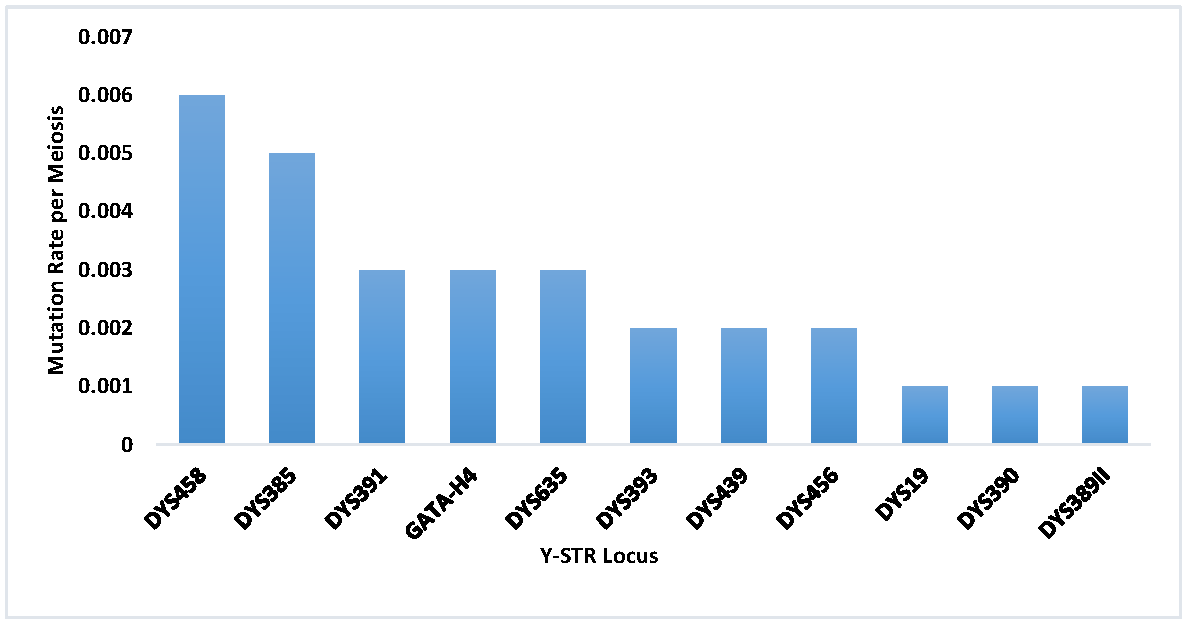
A total of 292 paternal lineage cases were analyzed, comprising 66 sibling and grandparentage cases, 133 uncle–nephew cases, 70 first-cousin cases, and 23 second-cousin cases. Across these cases, 29 mutational events were identified at 11 of the 16 Y-STR loci examined, as shown in Table 1. No mutations were found at five loci: DYS389I, DYS392, DYS437, DYS438, and DYS448. This suggests relative stability of these five loci in the studied dataset; however, larger datasets would be required to confirm locus-specific stability in the wider population. All observed mutations were single-step changes, consistent with the stepwise mutation model, as summarized in Table 2. The observed proportion of mutation-positive cases appeared to increase with greater genetic distance. A progressive increase in the proportion of mutation-positive cases was observed with increasing meiotic distance (siblings < uncle–nephew < first cousins < second cousins), consistent with the stepwise accumulation of mutations across generations. The highest observed proportion was noted in second-cousin pairs (13.04%), as shown in Table 1. This observed trend across relationship categories is illustrated in Figure 1. Per-locus mutation rates ranged from 0.001 to 0.006, as presented in Table 3, with the highest rates observed at DYS458 (0.006) and DYS385 (0.005), followed by DYS391, GATA-H4, and DYS365. The distribution of per-locus mutation rates is illustrated in Figure 2.
Distribution of observed Y-STR mutations among studied cases.
| Relationship Type | No. of Cases | Total Meioses | Mutations Observed | % of Cases with Mutation |
|---|---|---|---|---|
| Siblings & grandparentage | 66 | 2112 | 5 | 7.58% |
| Uncle-Nephew | 133 | 6384 | 13 | 9.77% |
| First cousins | 70 | 4480 | 8 | 11.43% |
| Second cousins | 23 | 2208 | 3 | 13.04% |
| Total | 292 | 15,184 | 29 | — |
Percentages represent the proportion of cases with at least one mutation within each relationship group. Total meioses were calculated by multiplying the number of cases by the relevant meiotic distance and the number of Y-STR loci examined.
Summary of mutation events by locus among studied cases.
| Y-STR Locus | No. of Mutations | Mutation Type | Example Allele Shift |
|---|---|---|---|
| DYS385 | 5 | Single-step | 16→15, 17→16,15→16,13→14,19→18 |
| DYS391 | 3 | Single-step | 10→11, 11→10 |
| DYS458 | 6 | Single-step | 16→17, 18→19,17→16,18→17,18→19 |
| DYS19 | 1 | Single-step | 18→19 |
| DYS393 | 2 | Single-step | 14→13,13→14 |
| GATA-H4 | 3 | Single-step | 13→12,12→13 |
| DYS439 | 2 | Single-step | 11→10, 12→13 |
| DYS365 | 3 | Single-step | 20→21, 22→23 |
| DYS456 | 2 | Single-step | 13→14, 16→17 |
| DYS390 | 1 | Single-step | 24→25 |
| DYS389II | 1 | Single-step | 32→31 |
| Total | 29 | — | — |
All mutations were single-step changes, consistent with the stepwise mutation model. Example allele shifts are provided for representative cases.
Per-locus mutation rates with exact 95% confidence intervals.
| Y-STR Locus | Mutation Count (x) | Mutation Rate | 95% CI (Clopper–Pearson) |
|---|---|---|---|
| DYS458 | 6 | 0.006 | 0.0023–0.0137 |
| DYS385 | 5 | 0.005 | 0.0017–0.0123 |
| DYS391 | 3 | 0.003 | 0.0007–0.0092 |
| GATA-H4 | 3 | 0.003 | 0.0007–0.0092 |
| DYS365 | 3 | 0.003 | 0.0007–0.0092 |
| DYS393 | 2 | 0.002 | 0.0003–0.0077 |
| DYS439 | 2 | 0.002 | 0.0003–0.0077 |
| DYS456 | 2 | 0.002 | 0.0003–0.0077 |
| DYS19 | 1 | 0.001 | 0.0000–0.0059 |
| DYS390 | 1 | 0.001 | 0.0000–0.0059 |
| DYS389II | 1 | 0.001 | 0.0000–0.0059 |
* Mutation rates are reported to three decimal places, while confidence intervals are presented to four decimal places.
Discussion
This study provides preliminary data on Y-STR mutational patterns in the North Indian population and contributes to available data on paternal lineage markers. All the Y-STR mutations observed in this study were single-step changes, consistent with the stepwise mutation model of STR evolution [5,8]. No mutations were observed at five Y-STR loci: DYS389I, DYS392, DYS437, DYS438, and DYS448. These loci showed relative stability in the present dataset, supporting their usefulness in paternal lineage assessment; however, this finding should be interpreted cautiously because of the limited sample size. The predominance of single-step mutations is also consistent with findings reported across multiple populations. This suggests that Y-chromosomal STRs may follow broadly similar mutational mechanisms across diverse human populations [1,2].
Mutation rates at commonly used Y-STR loci may show broad similarities across populations; however, regional validation remains essential for accurate kinship analysis [1,3]. Even small population-specific differences in mutation rates can influence likelihood ratio calculations and the interpretation of kinship in relationship testing [3,6]. Therefore, estimates of mutations from regional populations help improve the statistical standardization and reliability of paternal lineage testing in Indian forensic casework. Among loci with observed mutations, the mutation rate in this study ranged from 0.001 to 0.006 per meiosis. This range is consistent with previously reported findings from studies of European and East Asian lineages, including large-scale father–son comparative datasets [1-2, 9]. Moreover, haplogroup-stratified analyses have demonstrated modest inter-haplogroup variability in mutation behavior, underscoring the importance of region-specific datasets for improved forensic standardization [3, 7-8]. Loci showing higher mutation frequencies, such as DYS458 and DYS385, may provide greater discriminatory value for distinguishing closely related paternal lineages [10-12]. Conversely, more stable Y-STR loci remain important for supporting paternal ancestry assessment. Loci such as DYS19 and DYS389II exhibited low mutation rates, indicating greater consistency for paternal lineage verification but lower discriminatory power for differentiating closely related male individuals. More mutations were observed in cases involving more distant paternal relatives, such as first cousins and second cousins. An increase in mutation frequency with greater meiotic separation was observed across the relationship categories, including sibling/grandparentage cases, uncle–nephew pairs, first cousins, and second cousins. The observed trend supports the expected pattern of gradual mutation accumulation across generations. Although the current sample size limits formal modeling of mutation rates, the observed pattern is consistent with extended lineage studies reporting variability in Y-STR mutation behavior across paternal lineages and haplogroups [2].
From a forensic casework perspective, locus-specific mutation rate estimates are essential for accurate statistical interpretation in paternal lineage testing. Y-STR loci with higher mutation rates can improve discrimination among closely related males, particularly in complex kinship investigations involving extended paternal relationships. However, even single-step mutations may result in apparent mismatches in father–son comparisons. Incorporating empirically derived mutation rates into likelihood calculations can reduce the risk of false exclusions and improve the reliability of forensic conclusions [3, 6, 13]. Future studies with larger sample sizes and detailed haplogroup characterization are required to refine population-specific Y-STR mutation rate estimates for India. Additionally, high-resolution Y-STR sequencing may help clarify specific mutational patterns [5]. Such advances are expected to enhance the forensic utility of Y-STR markers and support anthropological and genealogical studies in North Indian populations.
Conclusions
This study provides preliminary estimates of Y-STR mutation rates for selected loci in the North Indian population. All observed mutational events were single-step changes. The highest mutation rates were observed at DYS458 and DYS385, broadly aligning with reports from other populations. These findings highlight the importance of considering locus-specific mutation rates when differentiating closely related paternal lineages and interpreting possible mutational mismatches in kinship testing. Establishing population-specific Y-STR mutation data may enhance the reliability of forensic casework and genealogical applications in India.
6. Limitation
This study has certain limitations. First, haplogroup testing was not performed as part of routine casework; therefore, haplogroup-specific variation in mutation rates could not be assessed. Given that Y-STR mutational behavior may vary among haplogroups, this limits the generalizability of the findings. In conclusion, this study provides estimates of Y-STR mutation rates for specific loci in the North Indian population. All observed events were single-step mutations.
List of Abbreviations
| NRY | Non-Recombining Region |
| Y-STRs | Y-chromosomal short tandem repeats |
Author Contributions
Conceptualization: V.C.M., V.R.; Methodology: D.C., A.R.; Formal analysis: V.C.M., D.C., R.S.; Data curation: D.C., D.D.; Writing-original draft, writing-review & editing: V.C.M., D.D., A.R., R.S.; Visualization: V.R.; Supervision: V.R., V.C.M.; Project administration: V.C.M., V.R. All authors have read and agreed to the published version of the manuscript.
Availability of Data and Materials
The data supporting the findings of this study are included within the article.
Conflicts of Interest
The authors declare no conflicts of interest.
Funding
The study did not receive any external funding and was conducted using only institutional resources.
Ethics Committee Approval and Consent to Participate
This retrospective study was approved by the institutional review board (CH/002/2025, approval date: 22 March 2025). Written informed consent was obtained from all participants at the time of routine casework, including consent for participation and for publication.
Human Rights Statement
The study was conducted in accordance with the Declaration of Helsinki.
Acknowledgments
We are grateful to our laboratory colleagues for their kind support.
AI Declaration
While preparing this manuscript, the authors used Grammarly to improve readability and language. After using this tool, the authors reviewed and edited the content as needed and take full responsibility for the content of the publication.
References
- [1] Lee, D.G.; Kim, S.J.; Cho, W.C.; Cho, Y.; Park, J.H.; Lee, J.; Jung, J.Y. Analysis of Mutation Rates and Haplotypes of 23 Y-Chromosomal STRs in Korean Father–Son Pairs. Forensic Sci. Int. Genet. 2023, 65, 102875. [https://doi.org/10.1016/j.fsigen.2023.102875" target="_blank" rel="noopener">CrossRef] [PubMed]↑
- [2] Claerhout, S.; Vandenbosch, M.; Nivelle, K.; Gruyters, L.; Peeters, A.; Larmuseau, M.H.; Decorte, R. Determining Y-STR Mutation Rates in Deep-Routing Genealogies: Identification of Haplogroup Differences. Forensic Sci. Int. Genet. 2018, 34, 1–10. [https://doi.org/10.1016/j.fsigen.2018.01.005" target="_blank" rel="noopener">CrossRef] [PubMed]↑
- [3] Kayser, M. Forensic Use of Y-Chromosome DNA: A General Overview. Hum. Genet. 2017, 136, 621–635. [https://doi.org/10.1007/s00439-017-1776-9" target="_blank" rel="noopener">CrossRef] [PubMed]↑
- [4] Schlötterer, C.; Tautz, D. Slippage Synthesis of Simple Sequence DNA. Nucleic Acids Res. 1992, 20, 211–215. [https://doi.org/10.1093/nar/20.2.211" target="_blank" rel="noopener">CrossRef] [PubMed]↑
- [5] Antão-Sousa, S.; Amorim, A.; Gusmão, L.; Pinto, N. Mutation in Y STRs: Repeat Motif Gains vs. Losses. Forensic Sci. Int. Genet. Suppl. Ser. 2019, 7, 240–242. [https://doi.org/10.1016/j.fsigss.2019.09.092" target="_blank" rel="noopener">CrossRef]↑
- [6] Pinto, N.; Gusmão, L.; Amorim, A. Mutation and Mutation Rates at Y Chromosome Specific Short Tandem Repeat Polymorphisms (STRs): A Reappraisal. Forensic Sci. Int. Genet. 2014, 9, 20–24. [https://doi.org/10.1016/j.fsigen.2013.10.008" target="_blank" rel="noopener">CrossRef] [PubMed]↑
- [7] Parson, W.; Roewer, L. Publication of Population Data of Linearly Inherited DNA Markers in the International Journal of Legal Medicine. Int. J. Leg. Med. 2010, 124, 505–509. [https://doi.org/10.1007/s00414-010-0492-y" target="_blank" rel="noopener">CrossRef] [PubMed]↑
- [8] Valdes, A.M.; Slatkin, M.; Freimer, N.B. Allele Frequencies at Microsatellite Loci: The Stepwise Mutation Model Revisited. Genetics 1993, 133, 737–749. [https://doi.org/10.1093/genetics/133.3.737" target="_blank" rel="noopener">CrossRef] [PubMed]↑
- [9] Otagiri, T.; Sato, N.; Shiozaki, T.; Harayama, Y.; Hayashi, T.; Kobayashi, K.; Asamura, H. Mutation Analysis for 25 Y-STR Markers in Japanese Population. Leg. Med. 2021, 50, 101860. [https://doi.org/10.1016/j.legalmed.2021.101860" target="_blank" rel="noopener">CrossRef] [PubMed]↑
- [10] Ding, Q.; Hu, Y.; Koren, A.; Clark, A.G. Mutation Rate Variability across Human Y-Chromosome Haplogroups. Mol. Biol. Evol. 2020, 38, 1000–1005. [https://doi.org/10.1093/molbev/msaa268" target="_blank" rel="noopener">CrossRef] [PubMed]↑
- [11] Javed, F.; Shafique, M.; McNevin, D.; Javed, M.U.; Shehzadi, A.; Shahid, A.A. Empirical Evidence on Enhanced Mutation Rates of 19 RM-YSTRs for Differentiating Paternal Lineages. Genes 2022, 13, 946. [https://doi.org/10.3390/genes13060946" target="_blank" rel="noopener">CrossRef] [PubMed]↑
- [12] Ballantyne, K.N.; Goedbloed, M.; Fang, R.; Schaap, O.; Lao, O.; Wollstein, A.; Choi, Y.; van Duijn, K.; Vermeulen, M.; Brauer, S.; et al. Mutability of Y-Chromosomal Microsatellites: Rates, Characteristics, Molecular Bases, and Forensic Implications. Am. J. Hum. Genet. 2010, 87, 341–353. [https://doi.org/10.1016/j.ajhg.2010.08.006" target="_blank" rel="noopener">CrossRef] [PubMed]↑
- [13] Xue, Y.; Wang, Q.; Long, Q.; Ng, B.L.; Swerdlow, H.; Burton, J.; Skuce, C.; Taylor, R.; Abdellah, Z.; Zhao, Y.; et al. Human Y Chromosome Base-Substitution Mutation Rate Measured by Direct Sequencing in a Deep-Rooting Pedigree. Curr. Biol. 2009, 19, 1453–1457. [https://doi.org/10.1016/j.cub.2009.07.032" target="_blank" rel="noopener">CrossRef] [PubMed]↑